Market managed to bounce from recent drop, BUT is it sustainable? Are charts telling us next market move ahead!!!
Note:
Due to some bad data elements in month of August, our McClellan Index kept on giving us wrong suggestion, which in itself was intriguing. However, after correcting the data, now we see a better aligned picture. Moral of the story, NEVER base your decisions on only 1 piece of data, always rely on more than 1 source of information to avoid making wrong decisions. Since we use 2 piece of data elements, our decision never changed and we remained on correct path.
What is below chart telling us?
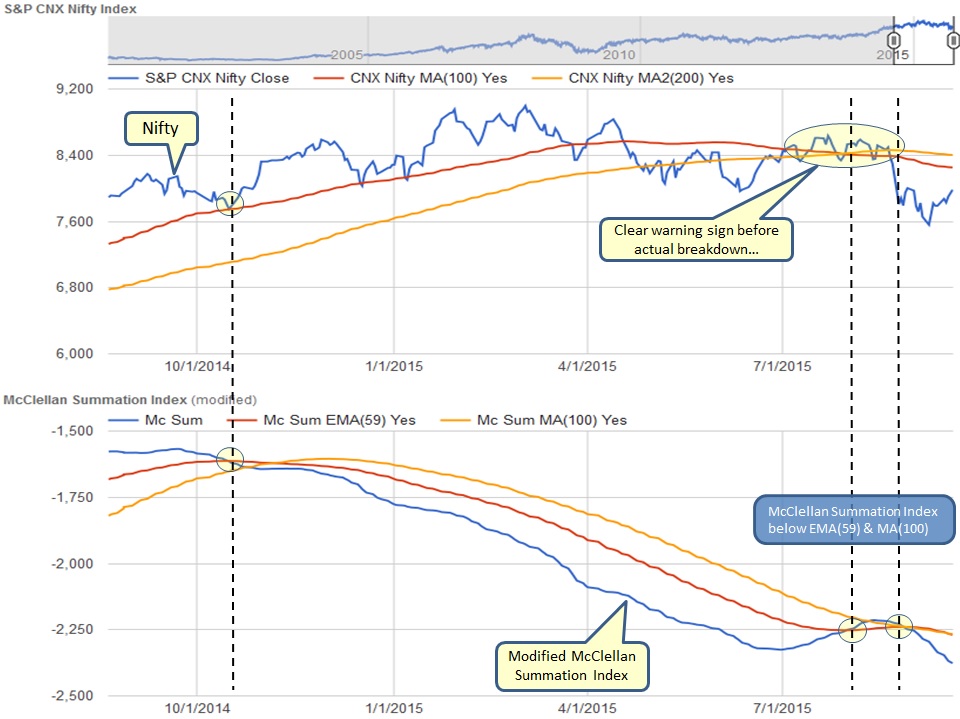
- Nifty remains below MA(100) while MA(100) remains below MA(200) - Both suggesting that market is in bearish mode and could take a while before we see a turnaround
- McClellan index below EMA(59) - Notice that McClellan index tried to get above EMA(59) but could not remain above it. Since more n more stocks are declining compared to advancing weeks over weeks cumulatively, as a result McClellan Index dropped below EMA(59) quickly suggesting to be very cautious as this market may have further downside
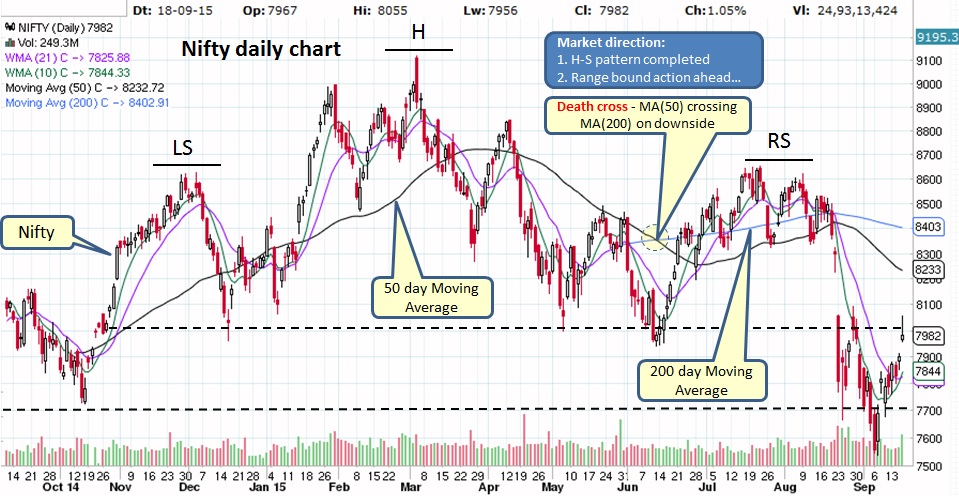
Daily Nifty chart shows current bounce attempt, however the last candle with a long top tail is not very convincing. It appears as if the bounce may be capped by resistance near 8000 area and market may continue to remain range bound for a while.
Weekly Nifty chart does show support and resistance areas clearly. Also note that RSI is below 50 mark and trending down for past several months while MACD is in downtrend along with PPO remaining below zero mark.

All signs suggest that current bounce may be capped for now and further downside can be expected in coming weeks/months ahead. Remain cautious as this market will experience wild swings ahead.
Remember, the path of least resistance is on downside but that does not mean this market cannot change direction. Market will do what it wants to do, we need to be prepared for next market move.
What does it mean for our Investments?
Market remains bearish, don't get fooled by the bounce...
Remember, the path of least resistance is on downside but that does not mean this market cannot change direction. Market will do what it wants to do, we need to be prepared for next market move.
What does it mean for our Investments?
- Mutual Funds - If still invested in equities too late to get out unless you want to get out now while the bounce lasts, also you might as well ride the correction and be prepared to take the hit. No reason to continue SIP at this point. If in cash/ FDs/ liquid funds then it is wise to stay on sidelines.
- Stocks - ONLY invest in strong patterns with good earnings guidance and DO NOT forget to have STOP LIMIT on open positions. When market is in correction, it will drag everything down with it. Check out our trade size calculator to manage your risk along with potential buy candidates watch list.
Market remains bearish, don't get fooled by the bounce...

 RSS Feed
