We are witnessing the pullback mentioned in our last post. After a rally of 1.5 months it is natural to undergo a pullback but most likely many got spooked and scared speculating further downside. So where are we headed?
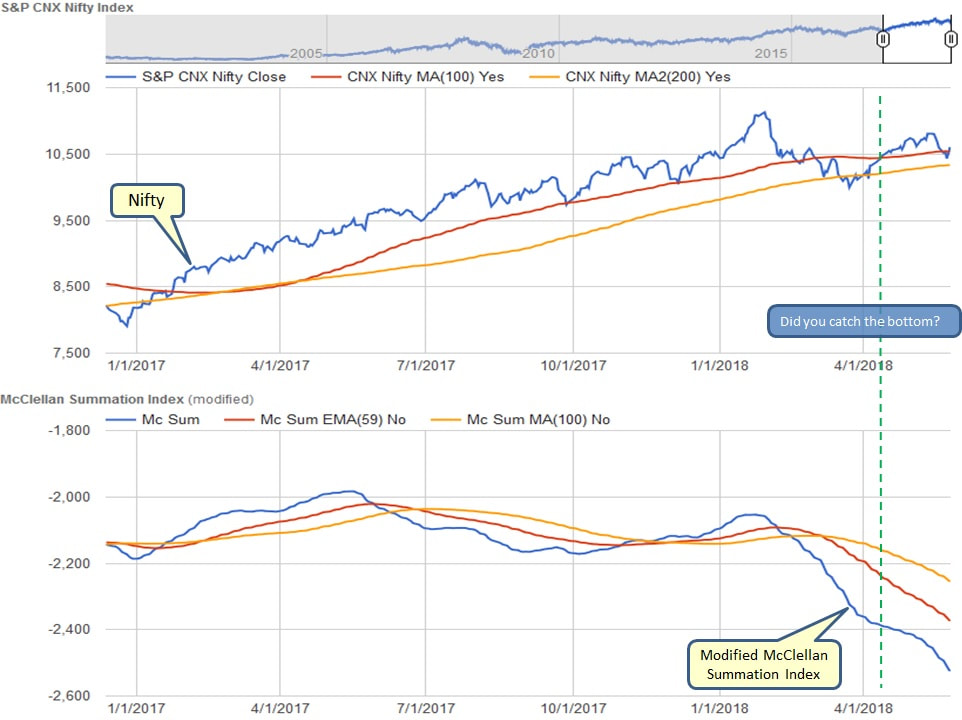
What is below chart telling us?
- Nifty back above MA(100) and MA(100 above MA(200) trending higher - Suggesting that market remains bullish and no need to worry as long as market stays above MA(100) or even between MA(100) & MA(200) area.
- McClellan Summation Index keeps dropping - Suggesting more stocks are declining than advancing.
Daily Nifty chart shows that market bounced off from MA(50) and should continue to move higher in steady fashion. RSI is back above 50 mark, PPO is right at zero mark and MACD should turn higher. If market does drop then we have a solid support near 10,100-10,200 area but dropping that far may not be a good sign of confidence.

Weekly chart is providing a subtle clue, take a look at the extreme right bar (also known as current bar). It is showing a long tail on downside which is considered bullish. Also look at red arrows during Jun-Jan 2015 and Jul-Jan 2018, can we find any similarities? Divergences during 2015 are very clear on all three below indicators but during 2018 only RSI was showing valid divergence, others are flat hence we do not believe that we are in same scenario.
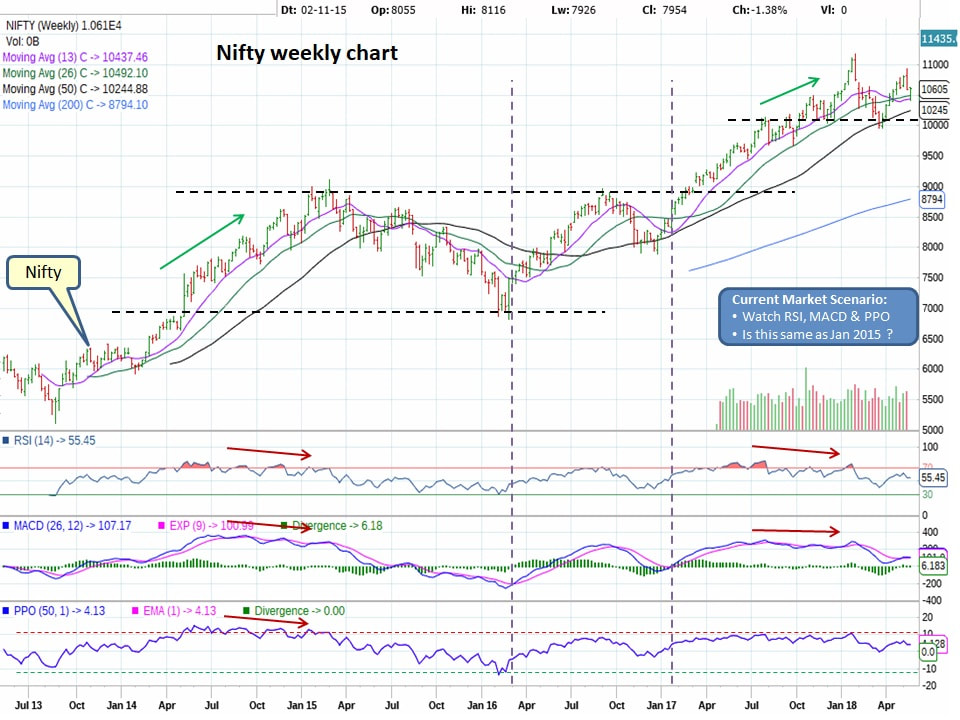
Current pullback is another low risk entry if you missed the bottom in March 2018 and market may make NEW HIGHs soon.
Market remains in bullish mode but be alert.
Market remains in bullish mode but be alert.

 RSS Feed
