Market topped on Feb 15th and has been going sideways for more than a month. However, there are plenty of signs suggesting what we shall expect in next few weeks if you know where to look at! So do you know what to check?
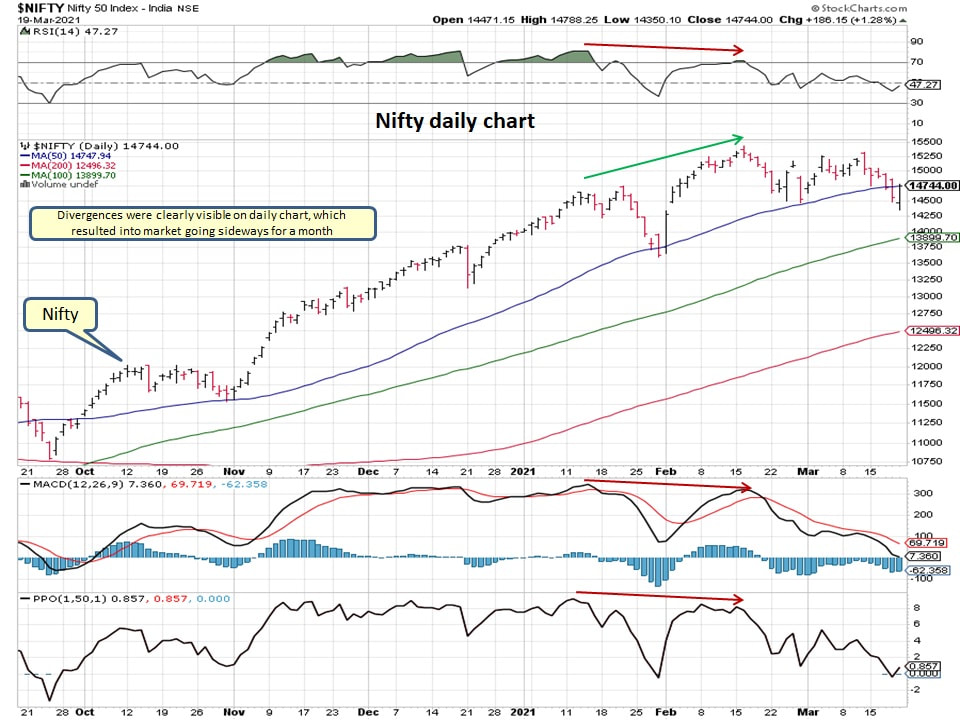
Let's look at below Nifty daily chart:
- RSI, MACD & PPO - all indicators displaying divergence before market reached the recent top
- MACD is about to go below zero - usually market cannot rally when MACD is below zero
- RSI has dropped below 50 mark
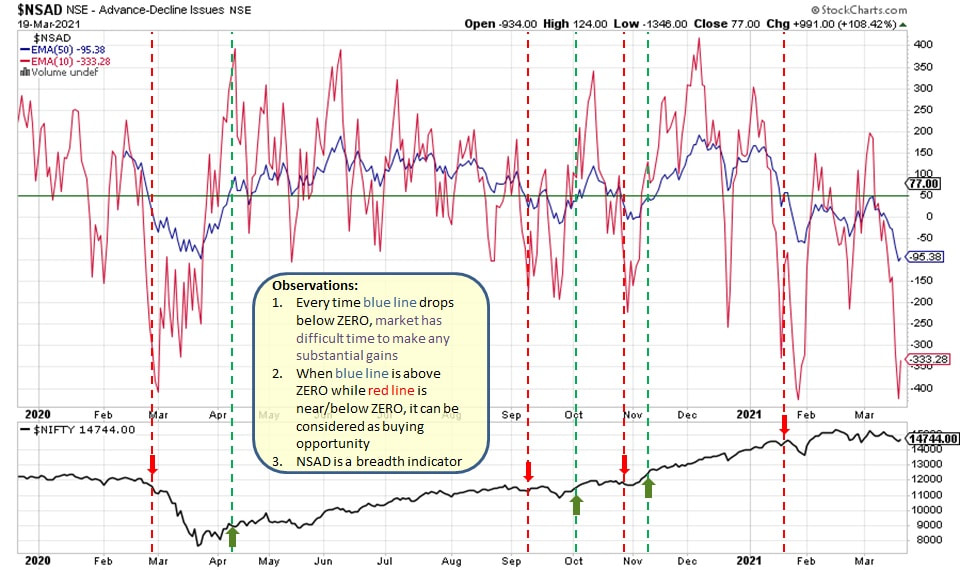
Below is Nifty Advance-Decline line (NSAD) daily chart: (another version can be checked here)
- NSAD line is not shown in below chart
- Observe the blue line which is 50 day EMA of NSAD - any time this drops below Zero then market has hard time to rally
- Observe the blue line which is 10 day EMA of NSAD - any time this drops below Zero and if blue line is above Zero then it can be considered as buying opportunity as market is in pullback mode, however when blue line is below Zero and red line is below zero suggests market can drop further as more stocks are declining than advancing
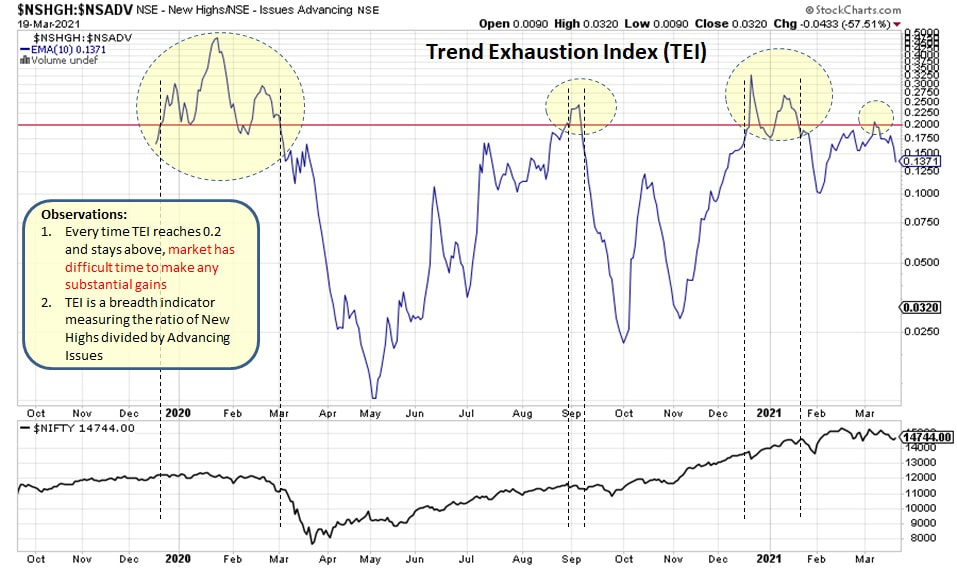
Nifty Trend Exhaustion Index:
Nifty vs Stocks above 200MA and 50MA:
- When the trend of stocks below 200MA (blue line) is declining suggests stocks are below their 200MA
- When the trend of stocks below 50MA (purple line) is declining suggests stocks are below their 50MA
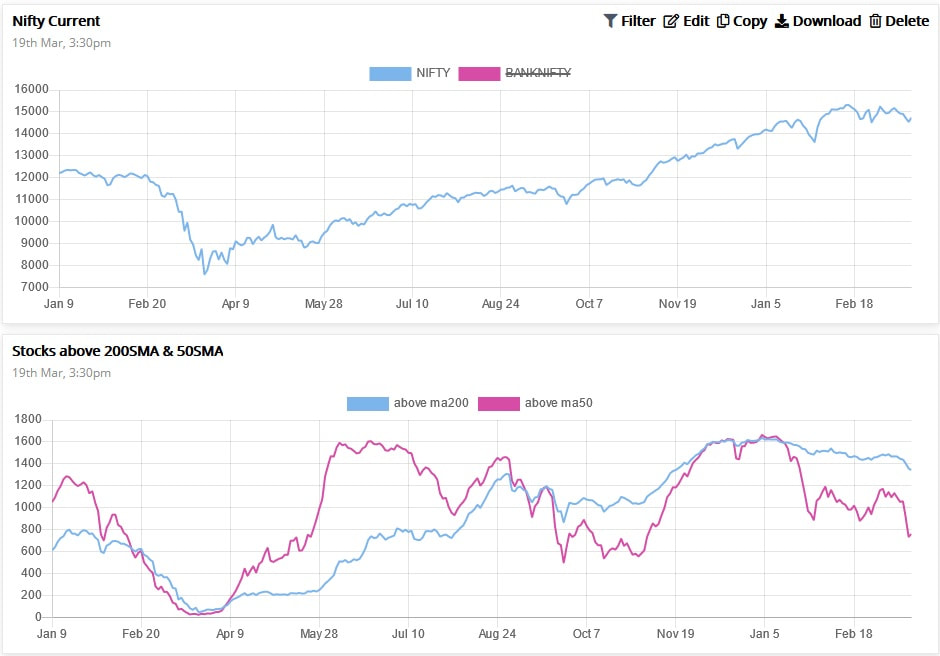
Based on all above charts and breadth indicators, the path of least resistance is towards downside suggesting market has a higher probability to drop further towards 100MA near 13750. Remember, it is a game of probability and we want to have odds on our side, hence it will be wise to remain cautious in current market environment before initiating new positions.
Market rally remains under pressure, be cautious!
Market rally remains under pressure, be cautious!

 RSS Feed
