For many months, we have been mentioning about panic drop. It appears that the stage is setting up for such a drop but what will be the magnitude and timeline for such a scenario? How do we prepare ourselves!!!
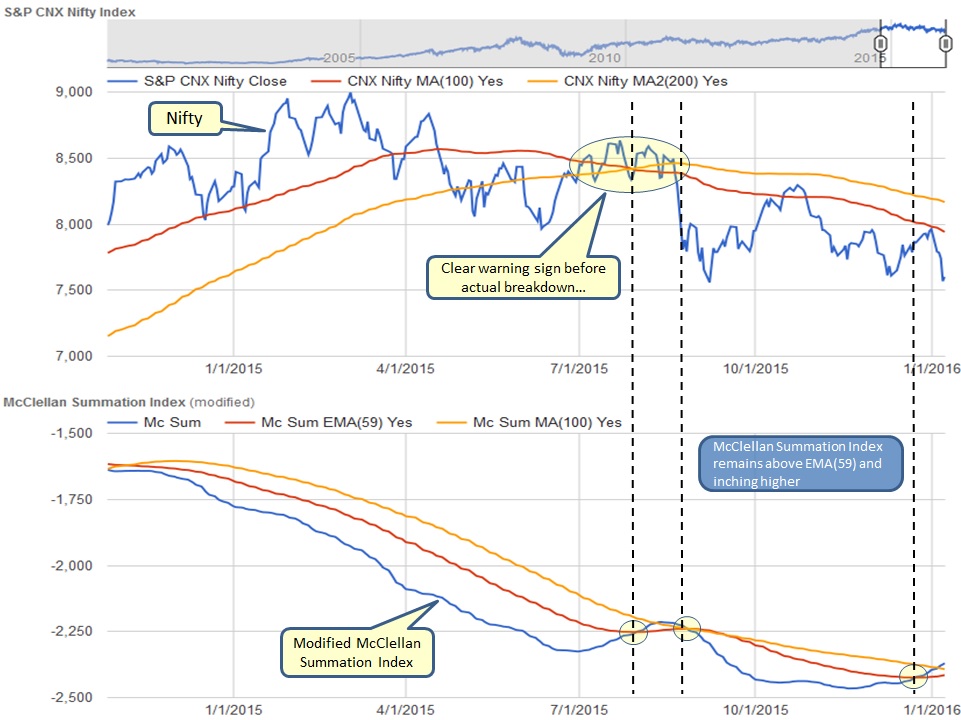
Below chart is telling us two key things:
- Nifty could not get above MA(100) - suggesting market remains bearish and vulnerable
- McClellan Index remains above EMA(59) and trending higher - suggesting more stocks are advancing than declining in cumulative manner
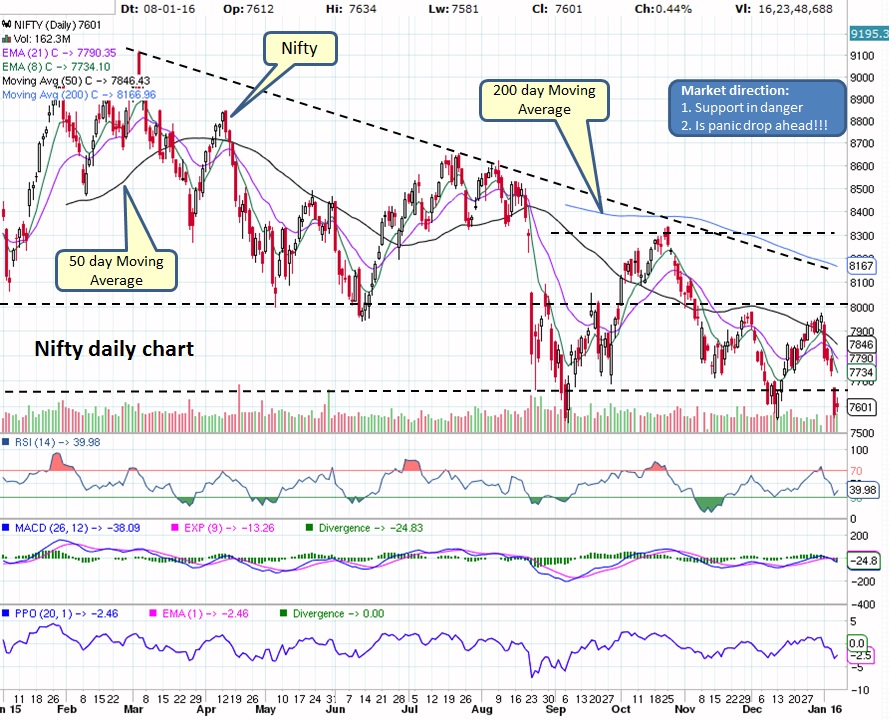
Market is barely hanging on to the support near 7600 area and might try to bounce from current levels or take a breather. However, we believe this support will soon be broken to test next support level near 7200 area.
Weekly chart suggest that next support level is near 7200 area but a panic drop has potential to take this market all the way to 6800 area. Of-course it wont happen in 1 day or 1 week but over several weeks or months. Observe, how RSI & PPO could not penetrate respective trend lines.
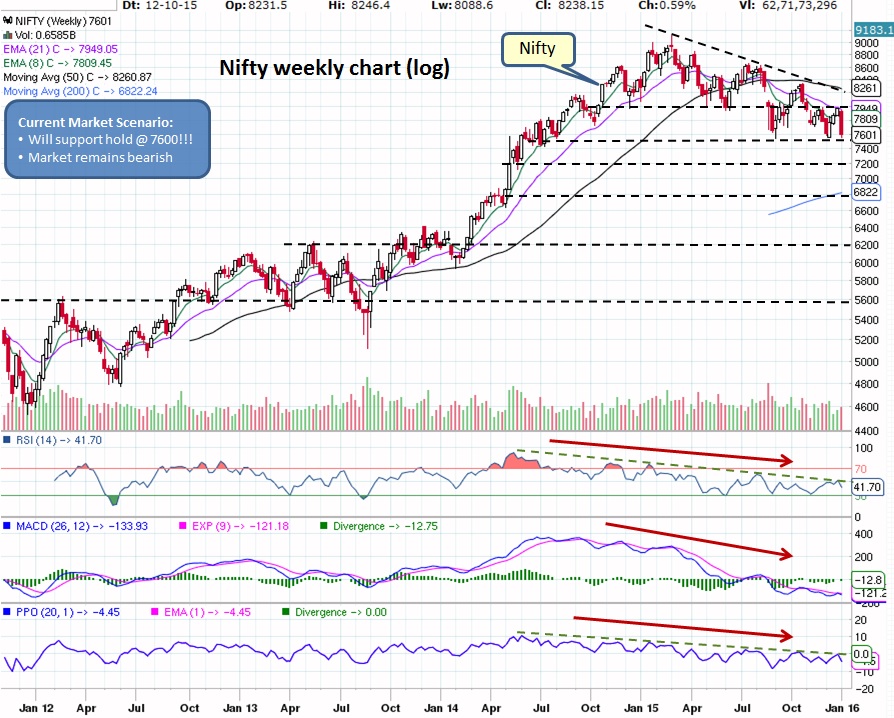
Due to global market sell-off, market might get pushed into panic territory. Based on charts, the path of least resistance appears to be on downside. We speculate, that we shall see the panic drop in next 3-6 months and then a slow & steady recovery which will set the stage for next major BULL market of your life time.
What does it mean for our Investments?
Market remains bearish stay away...
What does it mean for our Investments?
- Mutual Funds - If still invested in equities then time to hold onto this roller coaster ride, exiting now will be very expensive. No need to rush to start SIP unless we get positive trend reversal signs. If in cash/ FDs/ liquid funds then it is wise to stay on sidelines.
- Stocks - ONLY invest in strong patterns with good earnings guidance and DO NOT forget to have STOP LIMIT on open positions. When market is in correction, it will drag everything down with it. Check out our trade size calculator to manage your risk along with potential buy candidates watch list.
Market remains bearish stay away...

 RSS Feed
