Market rally appears to be never ending, Isn't it! Are you hating it? Did you successfully catch the bottom? Are we going to get a meaningful pullback!!! Let's check if charts are giving us any clues...
In last blog post, we mentioned regarding possible bottom formation. It is also visible in below chart. Make sure you understand the mechanics of identifying a top or bottom. They are not formed in a day, rather it takes more than few days to form a top and bottom. Bottom does not mean the lowest point and Top does not mean the highest point. Think of it more like a range and things will become clear and easier.
Now is the time to identify possibility of a tentative top, but why! Can you justify a possible top?
Now is the time to identify possibility of a tentative top, but why! Can you justify a possible top?
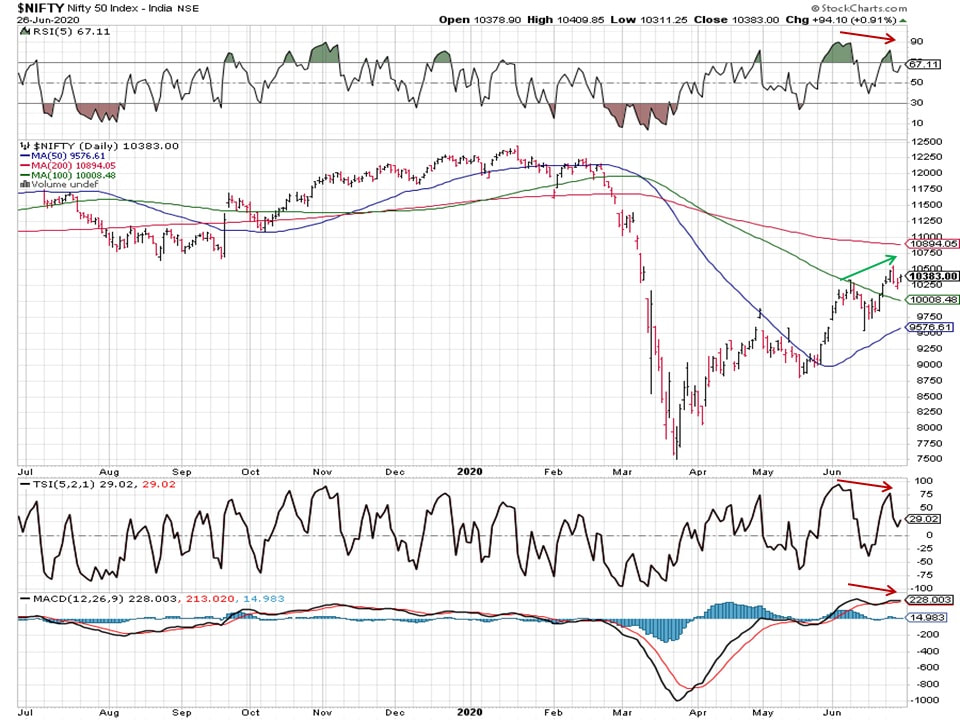
Above chart provides couple of clues:
Does it mean we have a short term top in place?
Not exactly, remember its game of probability and possibility. We have markings of possible top due to divergences but market can continue to rally higher or go sideways for few more days or even weeks. Have you identified #4 above yet? Did you check for overhead resistance? We have a significant resistance near 200day moving average.
Most likely market will not sustain this rally for long and we shall see another melt-down. It might not be as severe as drop in March 2020, however we believe it could be scary especially now that Covid-19 cases are rising exponentially and a vaccine is not yet available which might bring the economy to stand still again!!!
Get ready for a wild roller coaster ride ahead.
Good luck!
- RSI divergence with Price shown by arrows
- TSI divergence with Price shown by arrows
- MACD divergence with Price shown by arrows
- There is 1 more item we did not mention or show on above chart, can you identify it?
Does it mean we have a short term top in place?
Not exactly, remember its game of probability and possibility. We have markings of possible top due to divergences but market can continue to rally higher or go sideways for few more days or even weeks. Have you identified #4 above yet? Did you check for overhead resistance? We have a significant resistance near 200day moving average.
Most likely market will not sustain this rally for long and we shall see another melt-down. It might not be as severe as drop in March 2020, however we believe it could be scary especially now that Covid-19 cases are rising exponentially and a vaccine is not yet available which might bring the economy to stand still again!!!
Get ready for a wild roller coaster ride ahead.
Good luck!

 RSS Feed
