wAs mentioned in our last post, market appeared to have bottomed and now on its way to making NEW HIGH. We hope anyone waiting for the BULL train is finally on board. BUT, how can we verify if the bottom is in?
Observations from below chart:
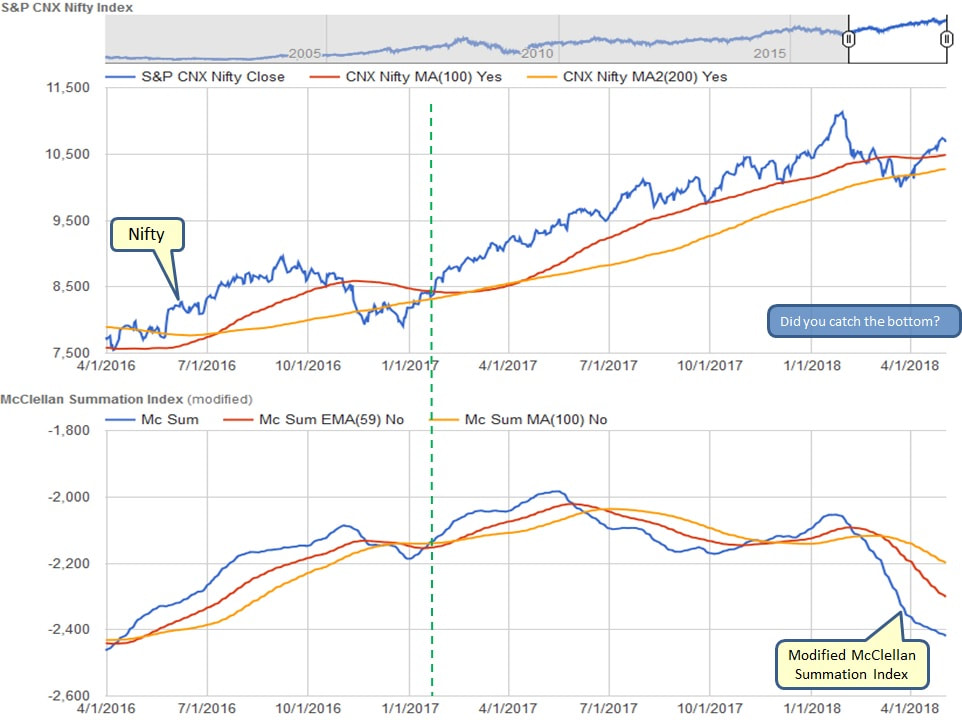
- Nifty back above MA(100) - this was a BUY signal
- MA(100) well above MA(200) and trending higher
- McClellan summation index will turn around soon, however it is not a requirement
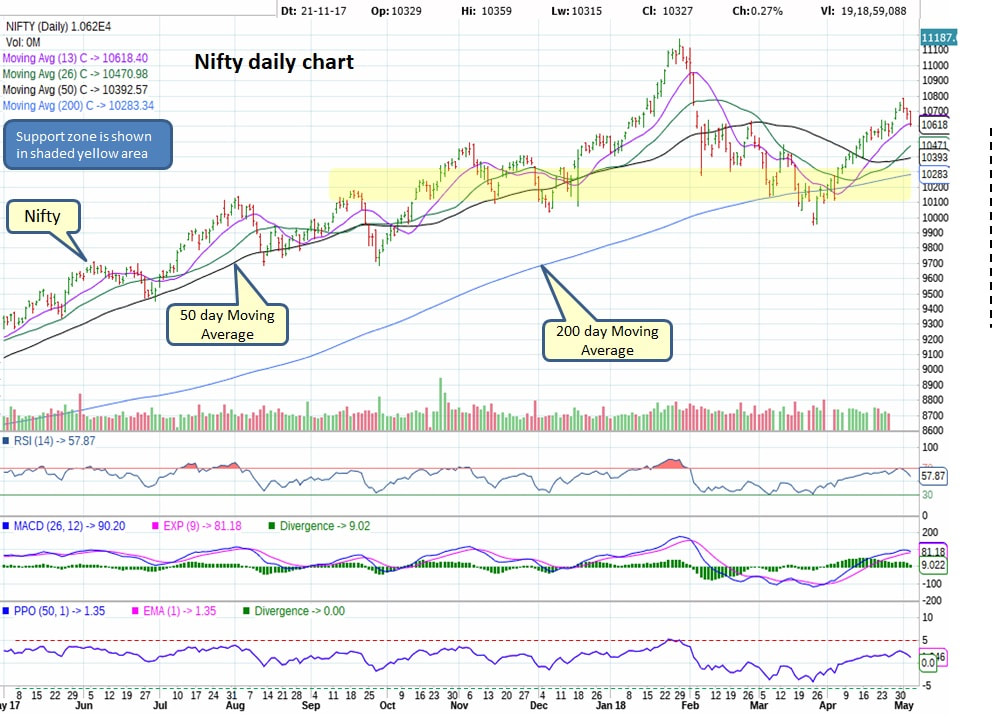
Market fooled everyone who was watching the support zone by marginally breaking below the support area and right back above. This was a classic action to flush out the speculators and provided an awesome opportunity to get in at low risk. Check PPO indicator at the bottom part of below chart, perfect bounce as soon as PPO reaches -5 area along with MACD crossover.
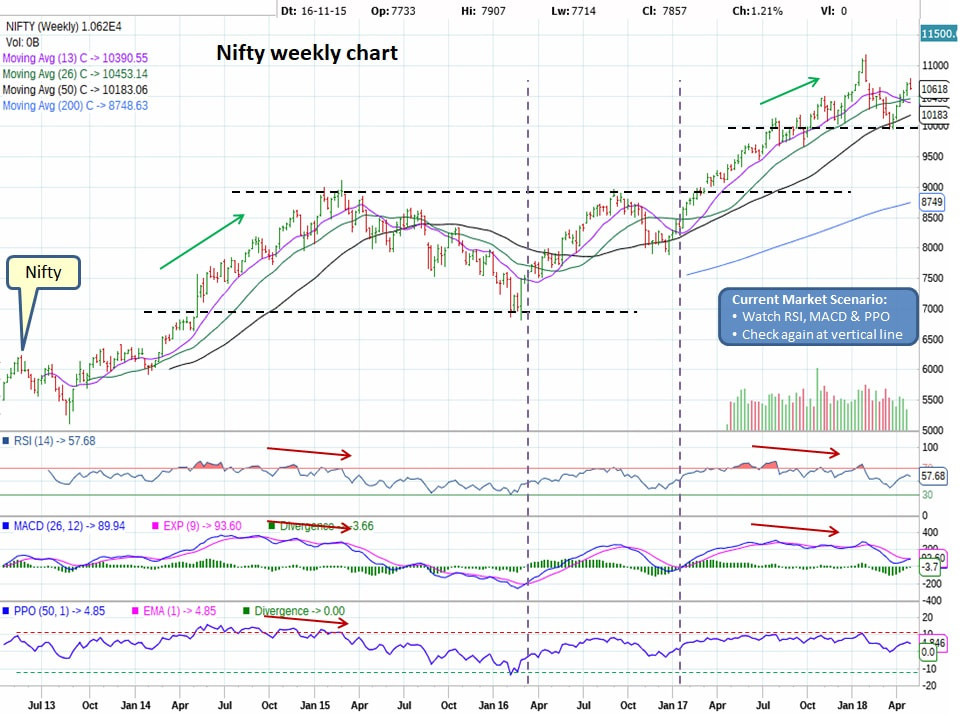
Weekly chart below displays that RSI is back above 50 mark, MACD bullish crossover almost happening. Also observe, when PPO was close to 10, market entered pullback.
Assuming market has bottomed and rallied above MA(100), we expect market to take a breather and might have a small pullback between 10,300-10,400 area before continuing the BULL rally.
However, if market drops below MA(100) area then we need to be cautious and watch how market behaves with MA(200).
Market moving into bullish mode....
However, if market drops below MA(100) area then we need to be cautious and watch how market behaves with MA(200).
Market moving into bullish mode....

 RSS Feed
