Market is finding it difficult to maintain current pace as it has to overcome resistance. BUT the key question remains "Is this start of the next BULL run?". Let's understand charts for a possible clue...
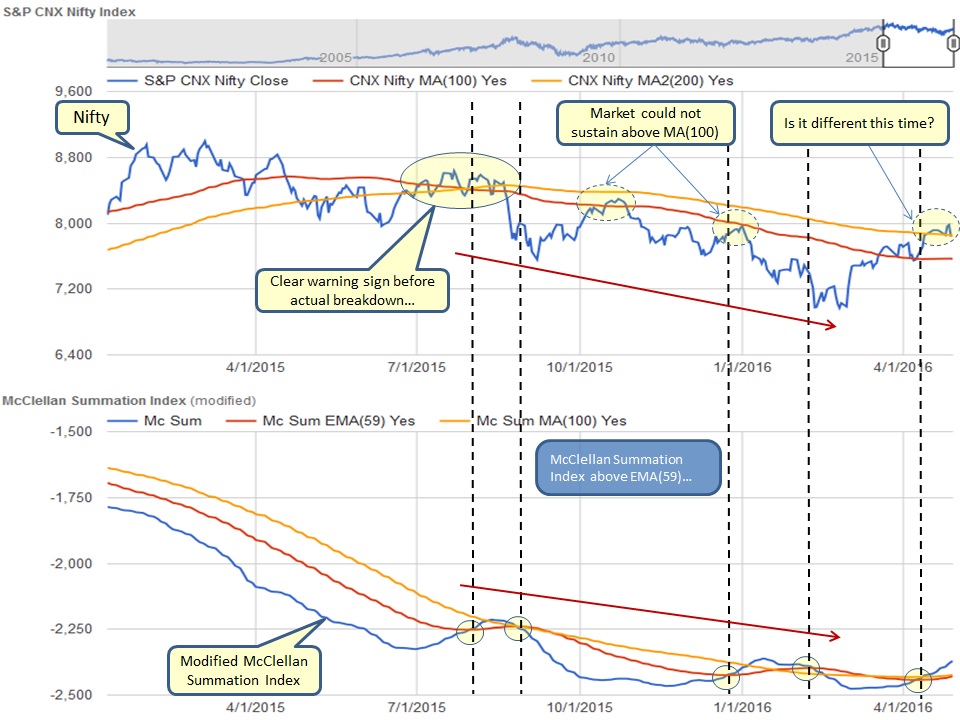
The first thing that comes to the mind looking at below chart is that "Is it really different this time?". Observe carefully, earlier market struggled to get above MA(100) and could not penetrate MA(200), however this time it has successfully managed to break above MA(100) and even MA(200). BUT can it remain above MA(200)?
Market is hitting resistance at current level (which we shall see in next chart) hence the most likely scenario is to expect a pullback. But if it cannot sustain above MA(200) and eventually drops below MA(100) then how is it different this time?
This is where we get the clue in below chart, watch the McClellan Summation Index. It appears to have turned around and at present above EMA(59) which means more stocks are advancing than declining in cumulative manner. But same thing happened in 2016 Jan-Feb yet market went down, however during those time, market was below MA(100). Check the historical chart here.
As long as McClellan Summation Index remains above EMA(59), any pullback in market is welcome at this juncture as it will present an excellent buying opportunity.
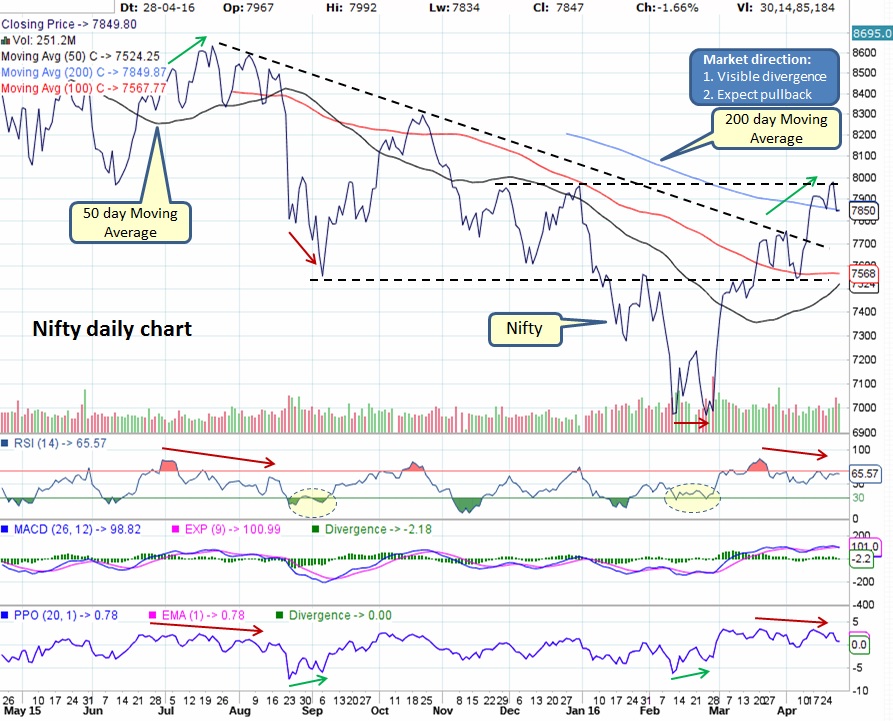
Why are we expecting pullback in this market?
(Observe the correlation between market and RSI, PPO shown by arrows)
(Observe the correlation between market and RSI, PPO shown by arrows)
- As market goes up, RSI is forming a divergence along with PPO which will eventually result into a pullback
- Also watch MACD which appears to be turning around
Weekly chart provides yet another clue that market is hitting against resistance near 8000 area hence a pullback can be expected, BUT also check out other clues such as RSI and PPO both managed to break through their dotted down trending line. This is telling us that a market has possibly put in a longer term bottom or at least close to one.
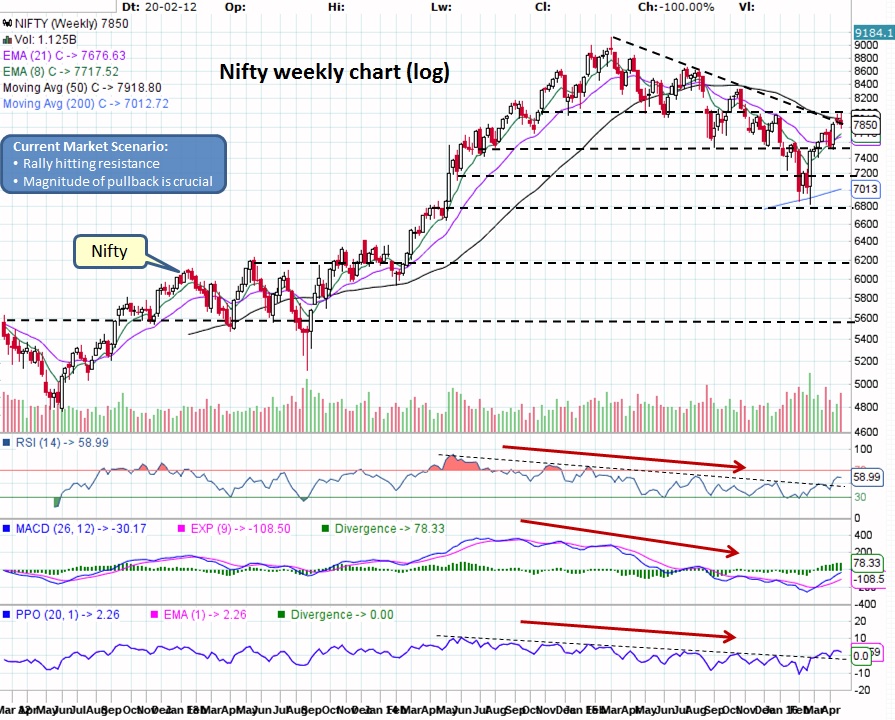
Charts are giving us many clues, all you need is an eye to look for them.
So what does this all tell us about overall health of the market as it stands today?
What does it mean for our Investments for now?
Try our Service -
Take a look at our service called "Quick Charts" which offers an easy visual way to look at daily and weekly charts of chosen stocks side-by-side. We hope it helps you in your research.
Market pullback expected, be cautious...
So what does this all tell us about overall health of the market as it stands today?
- Market has probably put in a long term bottom in Feb 2016 based on current chart patterns
- A pullback is most likely scenario at this juncture which shall linger around for next 2-3 months and should spook many investors, the magnitude of the pullback will determine if current rally was beginning of the next BULL run or simply a bear market rally
- McClellan Index has to stay above EMA(59), if it takes a dip below then it has to recover fast. This is absolutely critical as BULL market can only start if more and more stocks are advancing than declining
What does it mean for our Investments for now?
- Mutual Funds - If still invested in equities then time to sit tight, as we are on the cusp of turn around. No need to rush to start SIP unless we get positive trend reversal sign. If in cash/ FDs/ liquid funds then it is wise to stay on sidelines until we get confirmation. Be patient for low risk entry during the market pullback.
- Stocks - ONLY invest in strong patterns with good earnings guidance and DO NOT forget to have STOP LIMIT on open positions. When market is in correction, it will drag everything down with it. Check out our trade size calculator to manage your risk along with potential buy candidates watch list.
Try our Service -
Take a look at our service called "Quick Charts" which offers an easy visual way to look at daily and weekly charts of chosen stocks side-by-side. We hope it helps you in your research.
Market pullback expected, be cautious...

 RSS Feed
