Many of you might be wondering about the heading title, Isn't it!!! From where do we get this idea of turn around? Market continues to show no signs of life yet and then we see above heading. Well you should know where to look for early signs...
Early signs analysis is based on below chart and you will most likely NOT find it anywhere else for FREE:
- Nifty is still below MA(100) and MA(100) below MA(200) - Both suggesting market is in correction mode
- McClellan Index moved above EMA(59) while EMA(59) still below MA(100) - Suggesting more stocks are advancing than declining in cumulative manner, which should drive this market higher at some point

Daily chart suggest that Nifty is establishing support near 7600 area. However, moving up won't be easy as lot of overhead resistance is visible in below chart.

Weekly Nifty chart is in agreement with daily chart regarding establishing support near 7600 area. RSI has moved above 50 mark while PPO is hovering near zero mark, even MACD appears to be turning around.
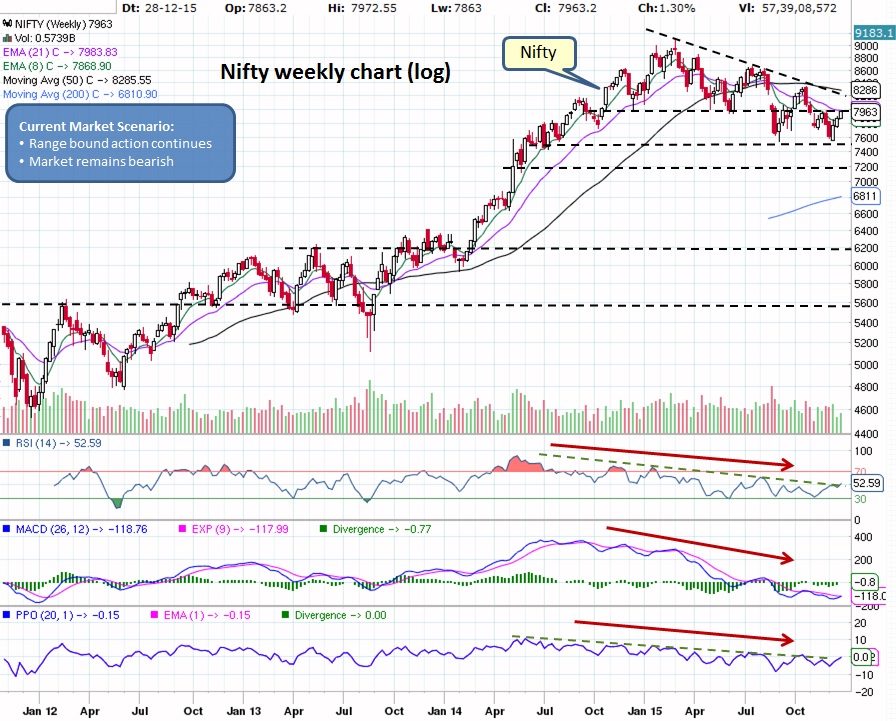
Overall, market continues to remain bearish and we may see volatile action before a trend confirmation. Based on charts, it appears that market may remain range bound for a while, but once a firm support is established then it will start taking out overhead resistances. Only time will tell, how long this process will take...
What does it mean for our Investments?
Market continues to establish base...
What does it mean for our Investments?
- Mutual Funds - If still invested in equities then time to hold on as turn around appears to be coming. No need to rush to start SIP unless we get positive trend reversal signs. If in cash/ FDs/ liquid funds then it is wise to stay on sidelines.
- Stocks - ONLY invest in strong patterns with good earnings guidance and DO NOT forget to have STOP LIMIT on open positions. When market is in correction, it will drag everything down with it. Check out our trade size calculator to manage your risk along with potential buy candidates watch list.
Market continues to establish base...

 RSS Feed
